istio Resilience
istio 네트워크 복원성 살펴보기
들어가며
마이크로서비스 환경에 들어오면서 모든 서비스는 네트워크를 통하게된다. 그렇기에 네트워크 회복탄련성이 중요해진다. 여기서는 실제 서비스 환경 그리고 MSA에서 자주 사용하는 패턴인 타임아웃, 리트라이, 서킷 브레이커 등을 설정한다.
실습 환경
앞의 포스트와 동일한 k8s(kind), istio 구성으로 진행한다. 여기서는 실습 파일에서 수정이 필요하다.
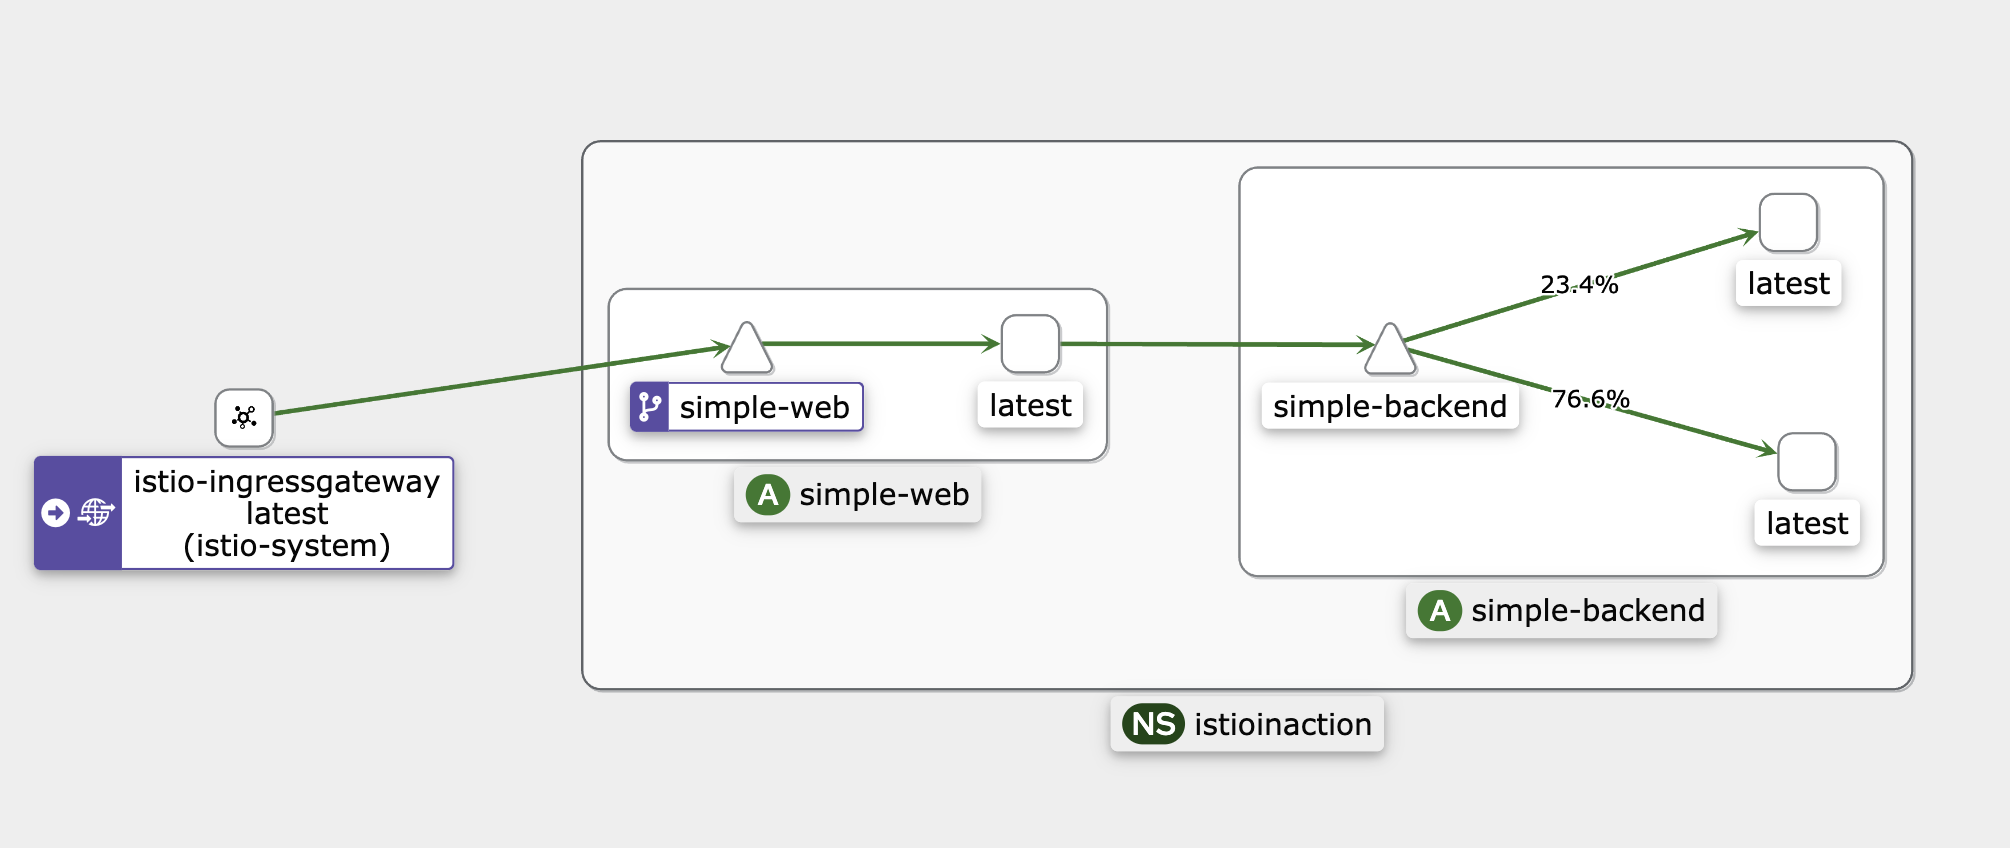
실습에 진행되는 리소스는 “istio ingress → simple-web → simple-backend” 구조이다.
simple-service-locality.yaml 파일에서 version label을 아래와 같이 달아준다.
1
2
3
4
5
6
7
8
9
10
11
12
13
14
15
16
17
18
19
20
21
22
23
24
25
26
27
28
29
30
31
32
33
34
35
36
---
apiVersion: apps/v1
kind: Deployment
metadata:
  labels:
    app: simple-backend
    version: v1
  name: simple-backend-1
spec:
  replicas: 1
  selector:
    matchLabels:
      app: simple-backend
  template:
    metadata:
      labels:
        app: simple-backend
        version: v1
---
apiVersion: apps/v1
kind: Deployment
metadata:
  labels:
    app: simple-backend
    version: v2
  name: simple-backend-2
spec:
  replicas: 2
  selector:
    matchLabels:
      app: simple-backend
  template:
    metadata:
      labels:
        app: simple-backend
        version: v2
Istio 설정은 다음과 같다. http://simple-web.istioinaction.io로 들어오는 트래픽을 simple web으로 라우팅한다. 이후 simple web에서는 simple-backend와 통신한다.
1
2
3
4
5
6
7
8
9
10
11
12
13
14
15
16
17
18
19
20
21
22
23
24
25
26
27
28
apiVersion: networking.istio.io/v1alpha3
kind: Gateway
metadata:
  name: simple-web-gateway
spec:
  selector:
    istio: ingressgateway
  servers:
  - port:
      number: 80
      name: http
      protocol: HTTP
    hosts:
    - "simple-web.istioinaction.io"
---
apiVersion: networking.istio.io/v1alpha3
kind: VirtualService
metadata:
  name: simple-web-vs-for-gateway
spec:
  hosts:
  - "simple-web.istioinaction.io"
  gateways:
  - simple-web-gateway
  http:
  - route:
    - destination:
        host: simple-web
배포 후 proxy 상태를 확인한다.
1
2
3
4
5
6
7
8
docker exec -it myk8s-control-plane istioctl proxy-status

NAME                                                  CLUSTER        CDS        LDS        EDS        RDS        ECDS         ISTIOD                      VERSION
istio-ingressgateway-996bc6bb6-5d7b6.istio-system     Kubernetes     SYNCED     SYNCED     SYNCED     SYNCED     NOT SENT     istiod-7df6ffc78d-5clcd     1.17.8
simple-backend-1-7449cc5945-9qpj2.istioinaction       Kubernetes     SYNCED     SYNCED     SYNCED     SYNCED     NOT SENT     istiod-7df6ffc78d-5clcd     1.17.8
simple-backend-2-6876494bbf-q4plp.istioinaction       Kubernetes     SYNCED     SYNCED     SYNCED     SYNCED     NOT SENT     istiod-7df6ffc78d-5clcd     1.17.8
simple-backend-2-6876494bbf-xxsqb.istioinaction       Kubernetes     SYNCED     SYNCED     SYNCED     SYNCED     NOT SENT     istiod-7df6ffc78d-5clcd     1.17.8
simple-web-7cd856754-tlkrm.istioinaction              Kubernetes     SYNCED     SYNCED     SYNCED     SYNCED     NOT SENT     istiod-7df6ffc78d-5clcd     1.17.8
도메인 설정을 진행하고,
1
echo "127.0.0.1       simple-web.istioinaction.io" | sudo tee -a /etc/hosts
접근을 진행해보면 정상적으로 접근한다.
1
2
while true; do curl -s http://simple-web.istioinaction.io:30000 | jq ".upstream_calls[0].body" ; date "+%Y-%m-%d %H:%M:%S" ; sleep 1; echo; done
또, 트래픽이 분배가 25:75로 확인된다. 이는 replicas의 수(1:2)에 따른 자연 분배이다.
1
2
3
4
5
6
kubectl get pods -n istioinaction
NAME                                READY   STATUS    RESTARTS   AGE
simple-backend-1-7449cc5945-9qpj2   2/2     Running   0          5m
simple-backend-2-6876494bbf-q4plp   2/2     Running   0          5m
simple-backend-2-6876494bbf-xxsqb   2/2     Running   0          5m
simple-web-7cd856754-tlkrm          2/2     Running   0          5m
Client-side LB
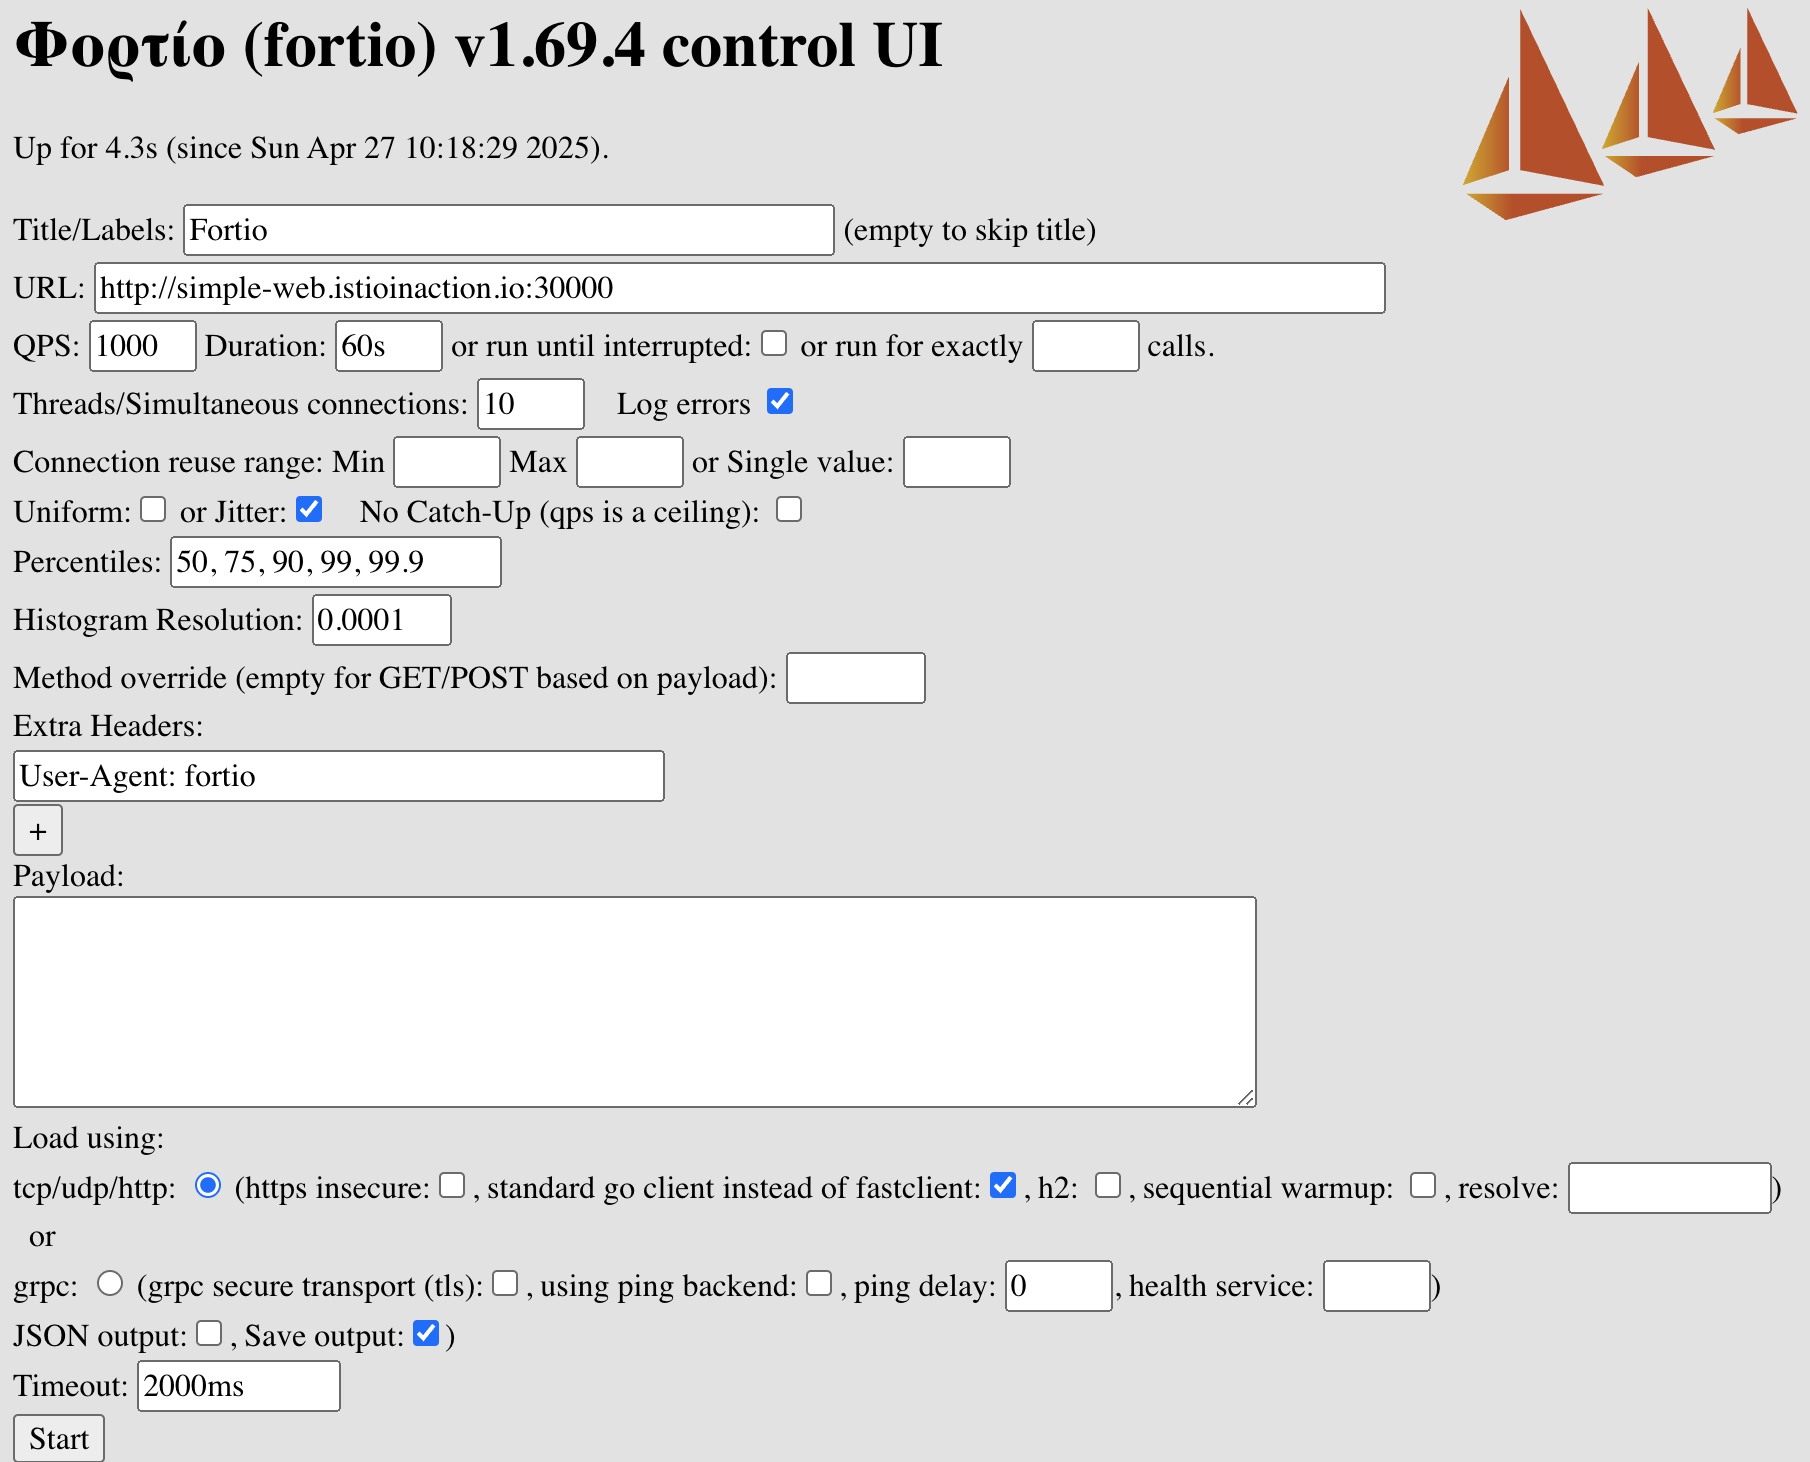
여기서는 istio가 제공하는 여러 가지 로드 밸런싱 규칙을 적용해볼 예정이다. 실습을 진행하기 이전에 올바른 비교를 위해 부하 생성 도구인 Fortio를 이용한다. 우리는 “Fortio를 사용해서 60초 동안 10개의 커넥션을 통해 초당 1000개의 요청을 보내 비교할 예정이다.”
fortio 설치(for MACOS)
1
brew install fortio
fortio server를 실행하여 웹에서 관련 값을 확인한다.
1
fortio server
이제 비교 위해 simple-backend-1에만 50% 확률로 1초의 지연시간 설정을 넣는다.
1
2
3
kubectl exec -it deploy/simple-backend-1 -n istioinaction -- sh
export TIMING_50_PERCENTILE=1000ms
하나의 파드에 대해서만 설정이 1000ms로 들어간 것을 확인할 수 있다.
1
2
3
4
5
kubectl describe pod -n istioinaction -l app=simple-backend | grep TIMING_50_PERCENTILE:

      TIMING_50_PERCENTILE:  1000ms
      TIMING_50_PERCENTILE:  150ms
      TIMING_50_PERCENTILE:  150ms
지연시간 확인
1
2
3
4
curl -s http://simple-web.istioinaction.io:30000 | grep duration

  "duration": "1.062647s",
      "duration": "1.002607s",
ROUND_ROBIN
simple-backend 서비스를 호출하는 모든 클라이언트의 로드 밸런싱을 ROUND_ROBIN으로 설정하자
DestinationRule 리소스를 통해 진행한다.
1
2
3
4
5
6
7
8
9
apiVersion: networking.istio.io/v1beta1
kind: DestinationRule
metadata:
  name: simple-backend-dr
spec:
  host: simple-backend.istioinaction.svc.cluster.local
  trafficPolicy:
    loadBalancer:
      simple: ROUND_ROBIN
설정 확인
1
2
3
kubectl get destinationrule simple-backend-dr -n istioinaction \
 -o jsonpath='{.spec.trafficPolicy.loadBalancer.simple}{"\n"}'
ROUND_ROBIN
쿠버네티스의 서비스는 기본적으로 공평하게 부하를 분산하다보니, 별반 다른 차이가 없다.
1
2
3
4
for in in {1..50}; do curl -s http://simple-web.istioinaction.io:30000 | jq ".upstream_calls[0].body"; done | sort | uniq -c | sort -nr

  36 "Hello from simple-backend-2"
  14 "Hello from simple-backend-1"
이제 벤치마킹을 위해 부하테스트를 진행한다. 설정값은 아래와 같다.
테스트가 종료되면 아래의 그림처럼, 그래프를 확인할 수 있고
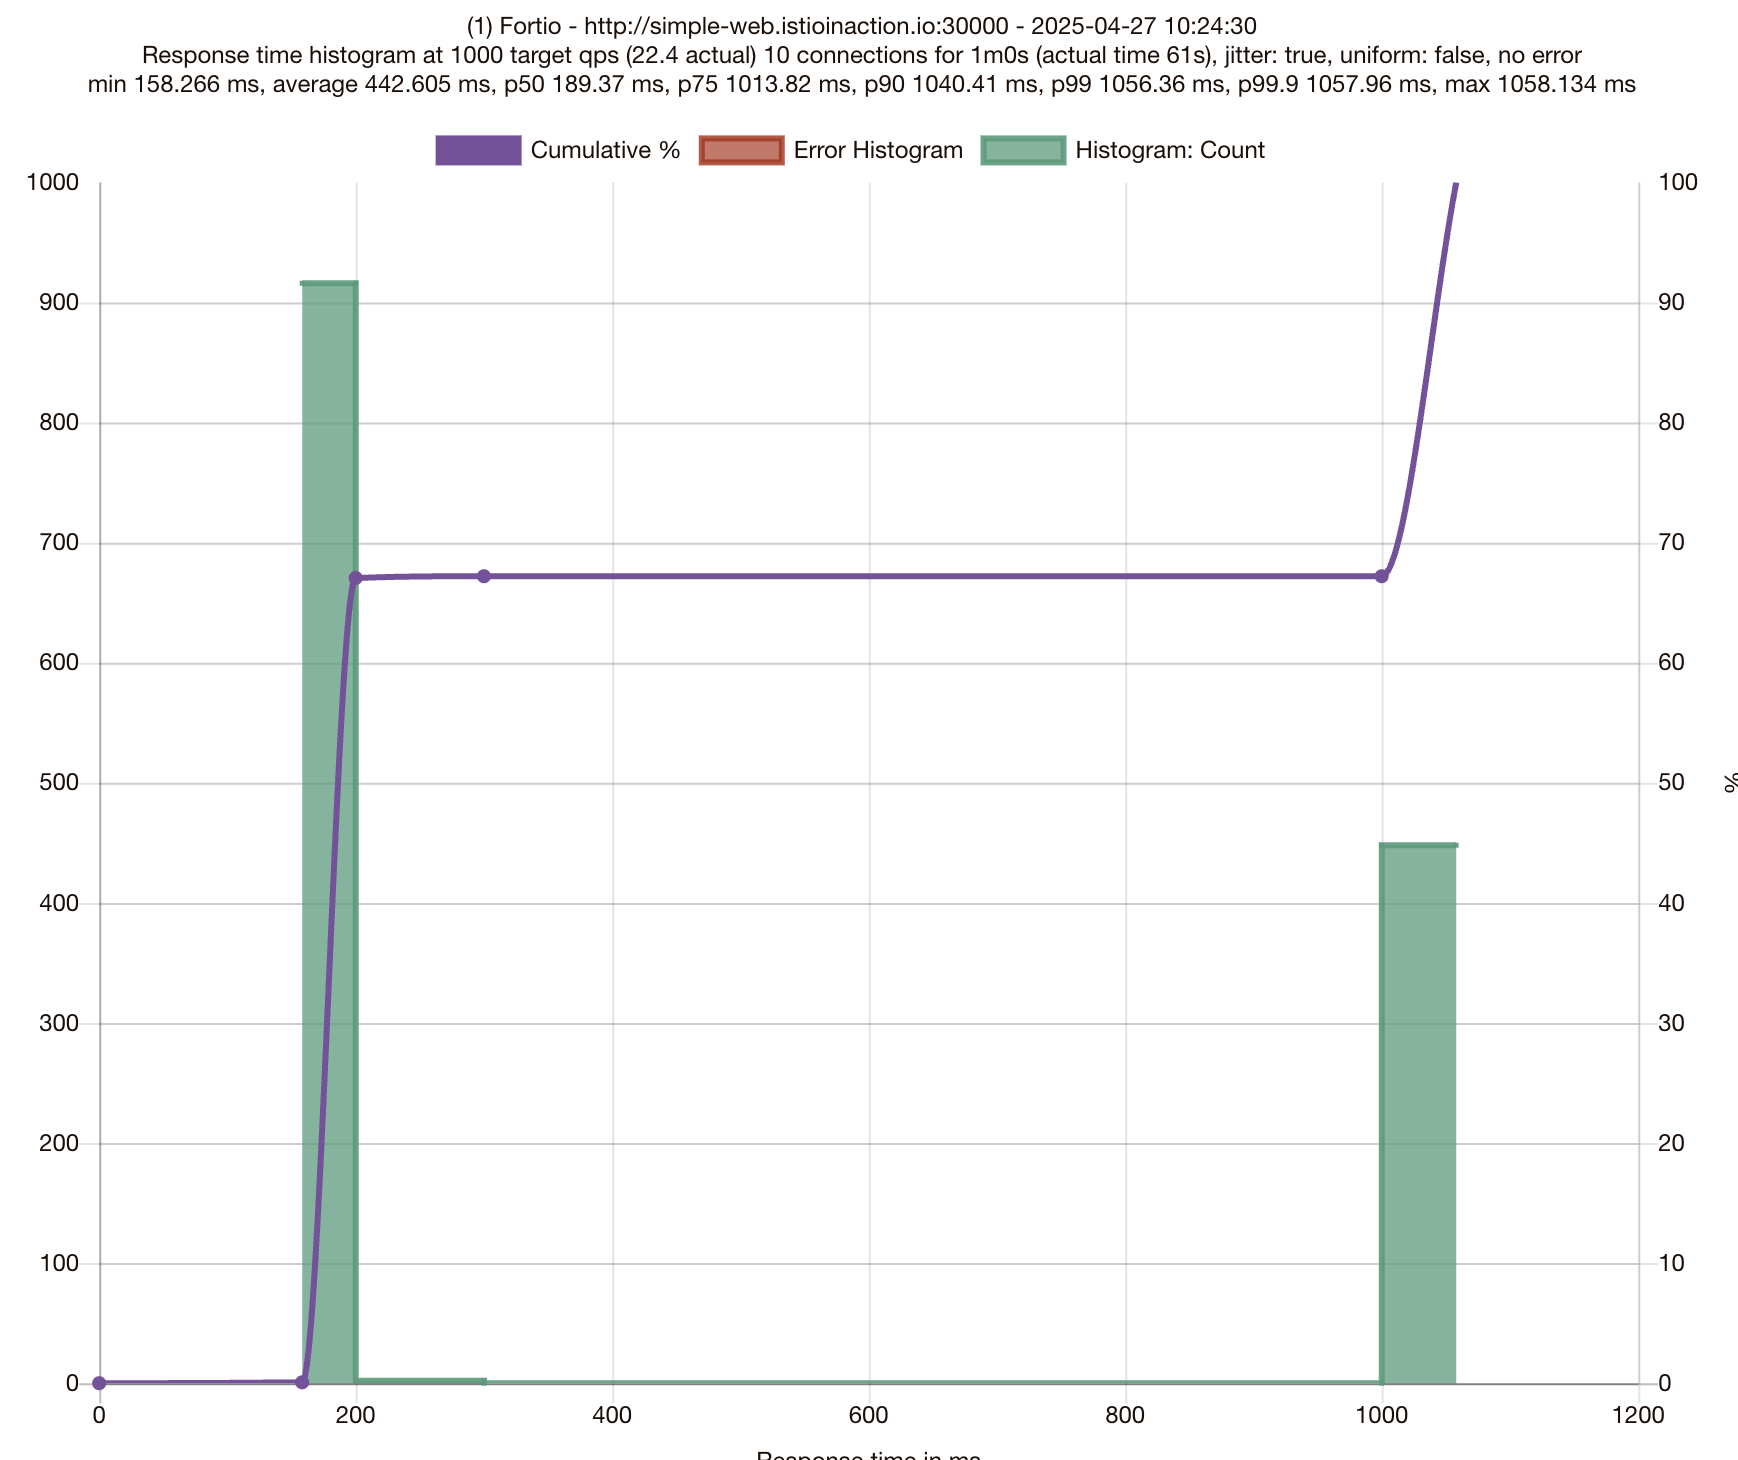
지연시간도 확인 가능하다. (75분위수에서 응답이 1초이상 걸린다.)
1
2
3
4
5
6
7
8
9
10
Aggregated Function Time : count 1366 avg 0.44260526 +/- 0.3993 min 0.158265917 max 1.05813375 sum 604.598783
# range, mid point, percentile, count
>= 0.158266 <= 0.2 , 0.179133 , 67.06, 916
> 0.2 <= 0.3 , 0.25 , 67.20, 2
> 1 <= 1.05813 , 1.02907 , 100.00, 448
# target 50% 0.189373
# target 75% 1.01382
# target 90% 1.04041
# target 99% 1.05636
# target 99.9% 1.05796
Least connection
로드 밸런싱 알고리즘을 Least connection으로 변경하여 테스트한다.
1
2
3
4
5
6
7
8
9
apiVersion: networking.istio.io/v1beta1
kind: DestinationRule
metadata:
  name: simple-backend-dr
spec:
  host: simple-backend.istioinaction.svc.cluster.local
  trafficPolicy:
    loadBalancer:
      simple: LEAST_CONN
Least connection 설정 확인
1
2
3
kubectl get destinationrule simple-backend-dr -n istioinaction \
 -o jsonpath='{.spec.trafficPolicy.loadBalancer.simple}{"\n"}'
LEAST_CONN
istio proxy config에서도 확인할 수 있다.
1
2
3
docker exec -it myk8s-control-plane istioctl proxy-config cluster deploy/simple-web.istioinaction --fqdn simple-backend.istioinaction.svc.cluster.local -o json | grep lbPolicy

        "lbPolicy": "LEAST_REQUEST",
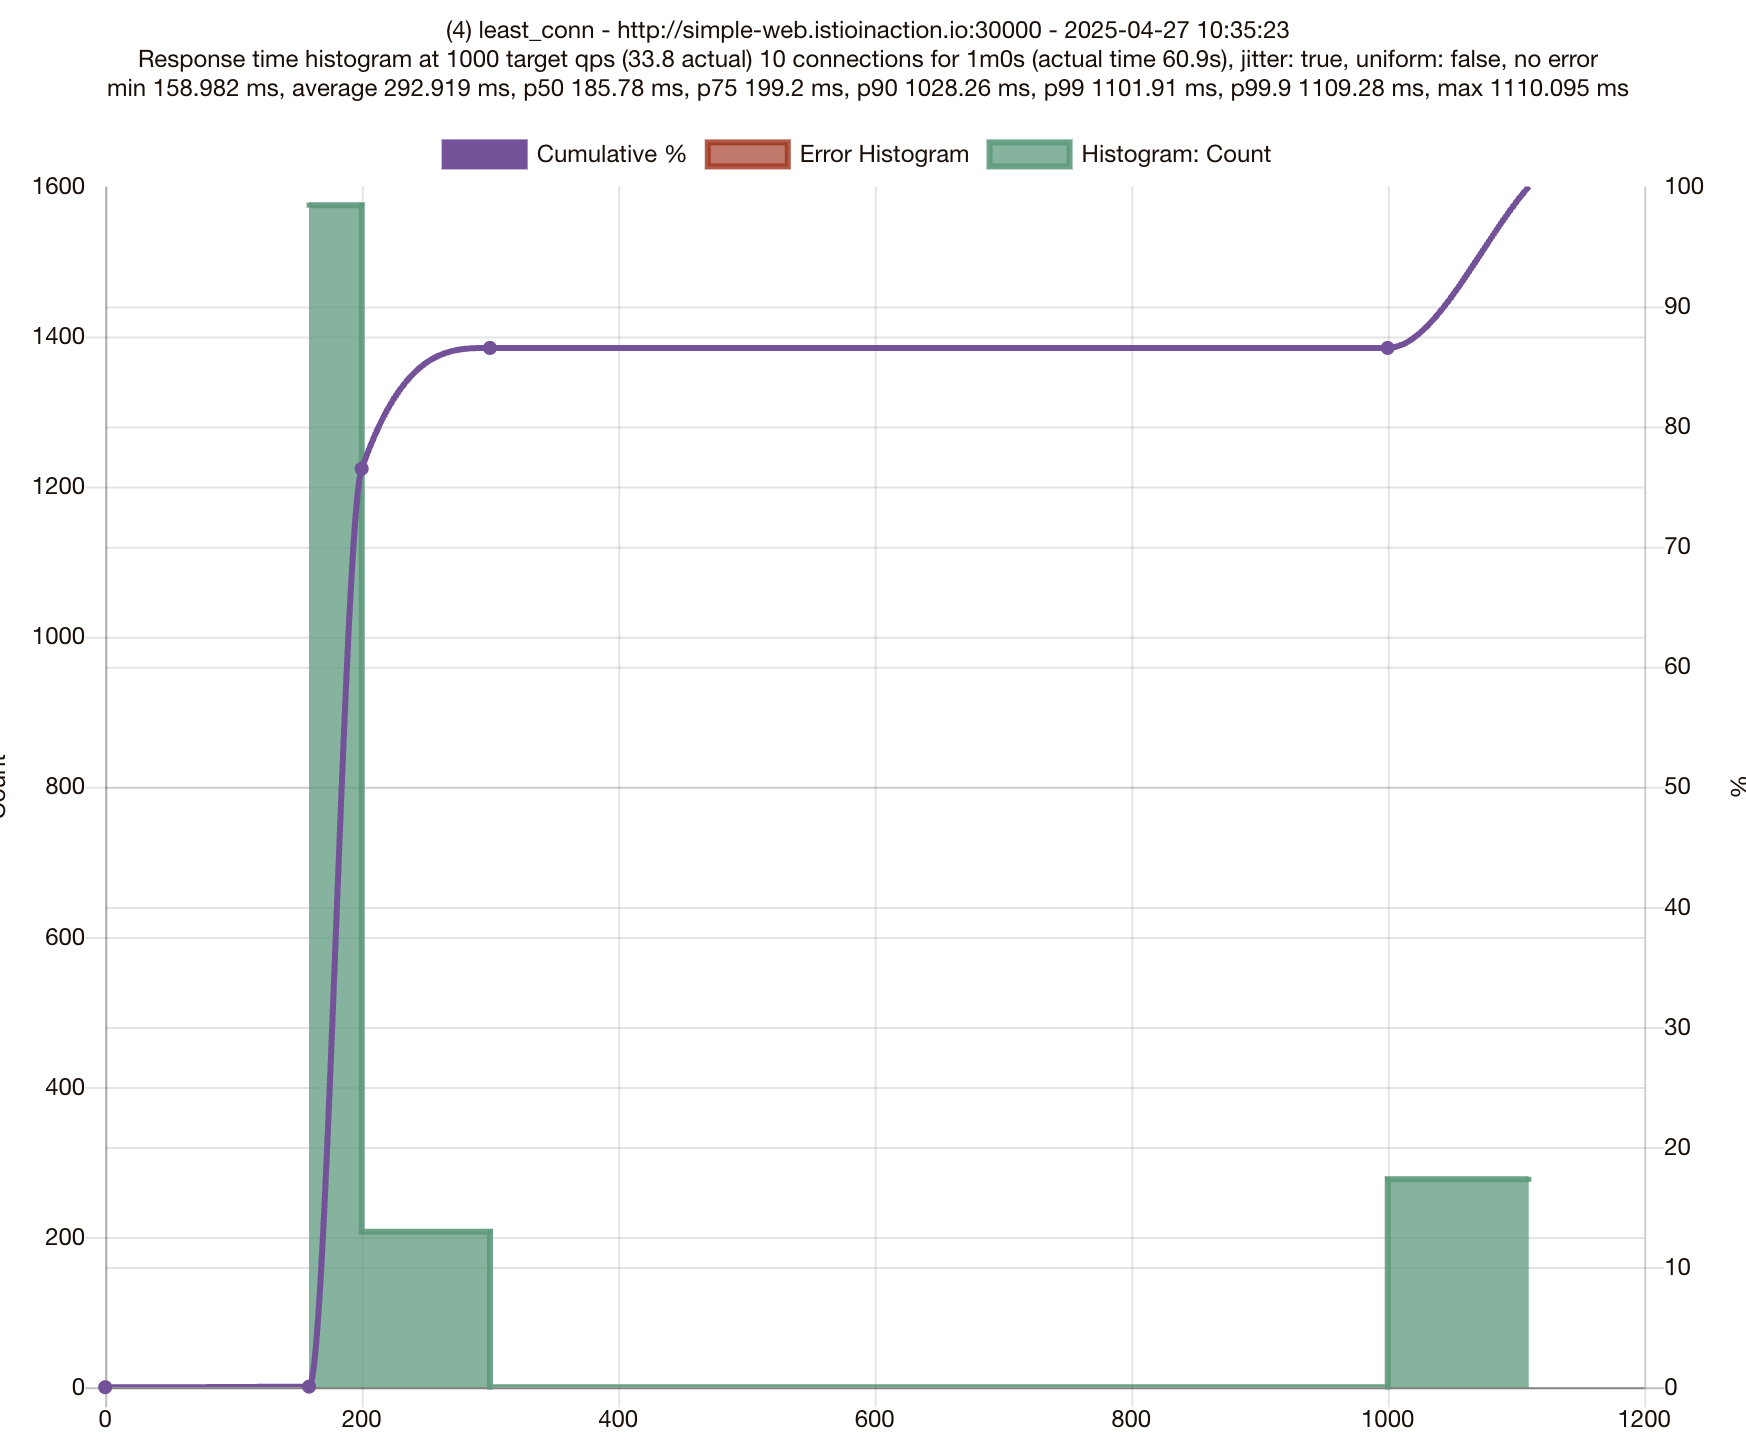
이제 동일하게 테스트를 진행한다.
테스트 진행 결과 75분위수에서 200ms 이내로, 이전(1.01382s)보다 좋은 성능을 보이고 있다.
1
2
3
4
5
6
7
8
9
10
Aggregated Function Time : count 2059 avg 0.29291901 +/- 0.2905 min 0.158981541 max 1.110094875 sum 603.120249
# range, mid point, percentile, count
>= 0.158982 <= 0.2 , 0.179491 , 76.49, 1575
> 0.2 <= 0.3 , 0.25 , 86.55, 207
> 1 <= 1.11009 , 1.05505 , 100.00, 277
# target 50% 0.185784
# target 75% 0.199199
# target 90% 1.02826
# target 99% 1.10191
# target 99.9% 1.10928
이를 통해 Least Conn이 RR, Random보다 성능이 좋다는 결론이 나온다. 이는 사실 어느정도 예상된 결과로 보인다. 우리는 3개 중 한 개의 백엔드 서버에 대해 50%확률로 응답이 딜레이되도록 하였다. 그렇기에 동일한 트래픽을 받을 때 딜레이된 서버는 활성 커넥션 개수가 다른 서버보다 많아지고 istio는 이 서버말고 다른 여유로운 서버에게 더 많은 트래픽을 보낸다. 덕분에 좋은 성능을 낼 수 있었다.
추가) 엔보이 최소 요청 로드 밸런싱(LEAST_CONN)은, 엔보이가 엔드포인트마다 파악하는 것은 요청 깊이지 커넥션이 아니라고 한다.
“The load balancer picks two random endpoints, checks which has the fewest active requests, and chooses the one with the fewest active requests.”
Locality-aware load balancing
글로벌 서비스를 운영할 대, 지역 기반으로 밸런싱을 하는 것은 중요해진다. 예시로, 유튜브 접속할 때 가까운 서버(ex. 캐싱 서버 등)를 나두고 미국 본토 서버와 통신해야 한다면 네트워크 홉이 길어지고 안정적으로 영상을 보기 힘들어진다. 특히 클라우드 환경에서는 다른 리전을 거치는 경우 추가 비용이 발생할 가능성이 크다.
Istio에서는 이런 지역 기반 밸런싱 기능을 default로 제공한다. “Locality aware load balancing is enabled by default”
각 파드의 label(istio-locality)을 확인한다.
- simple-backend-1
1
2
3
kubectl get deployment.apps/simple-backend-1 -n istioinaction \
-o jsonpath='{.spec.template.metadata.labels.istio-locality}{"\n"}'
us-west1.us-west1-a
- simple-backend-1
1
2
3
kubectl get deployment.apps/simple-backend-2 -n istioinaction \
-o jsonpath='{.spec.template.metadata.labels.istio-locality}{"\n"}'
us-west1.us-west1-b
지역 인식 로드밸런싱을 위해 지역에 맞게 트래픽을 라우팅해도 괜찮은지, 각 파드에 대한 별도 Health check가 필요하다. 아래의 설정을 추가한다.
1
2
3
4
5
6
7
8
9
10
11
12
apiVersion: networking.istio.io/v1beta1
kind: DestinationRule
metadata:
  name: simple-backend-dr
spec:
  host: simple-backend.istioinaction.svc.cluster.local
  trafficPolicy:
    outlierDetection:
      consecutive5xxErrors: 1
      interval: 5s
      baseEjectionTime: 30s
      maxEjectionPercent: 100
이제 다시 접근을 확인해보자. 50개의 요청 모두, simple-backend-1로 라우팅된다.
이는 simple-web과 simple-backend-1이 모두 istio-locality의 값이 us-west1.us-wets1-a로, istio는 두 파드를 같은 지역으로 인식하여 트래픽을 simple-backend-1으로만 라우팅한다.
1
2
3
for in in {1..50}; do curl -s http://simple-web.istioinaction.io:30000 | jq ".upstream_calls[0].body"; done | sort | uniq -c | sort -nr

  50 "Hello from simple-backend-1"
같은 리전내의 백엔드에 장애가 발생했을 떄
simple-backend-1 서비스에 잘못된 값 주입하여 장애 발생 상황을 테스트해보자.
1
2
3
4
5
6
7
...
        - name: "ERROR_TYPE"
          value: "http_error"
        - name: "ERROR_RATE"
          value: "1"
        - name: "ERROR_CODE"
          value: "500"
아래와 같이 istio proxy에서 엔드포인트가 FAILED되는 것을 볼 수 있다. istio는 내부적으로 해당 엔드포인트에 대한 라우팅 정보를 업데이트한다.
1
2
3
4
5
6
docker exec -it myk8s-control-plane istioctl proxy-config endpoint deploy/simple-web.istioinaction --cluster 'outbound|80||simple-backend.istioinaction.svc.cluster.local'

ENDPOINT            STATUS      OUTLIER CHECK     CLUSTER
10.10.0.18:8080     HEALTHY     OK                outbound|80||simple-backend.istioinaction.svc.cluster.local
10.10.0.21:8080     HEALTHY     OK                outbound|80||simple-backend.istioinaction.svc.cluster.local
10.10.0.22:8080     HEALTHY     FAILED            outbound|80||simple-backend.istioinaction.svc.cluster.local
이제 다시 접속해보면, simple-backend-1이 아닌 simple-backend-2로 라우팅된다.
1
2
3
for in in {1..50}; do curl -s http://simple-web.istioinaction.io:30000 | jq ".upstream_calls[0].body"; done | sort | uniq -c | sort -nr

  50 "Hello from simple-backend-2"
Timeout & Retry
애플리케이션에서 다른 서비스 요청이 필요할 때 재시도와 타임아웃설정이 필요하다. 간혈적인 이상(네트워크 등)을 제어하기 위해 retry 설정이 필요하고, 응답을 무한정 기다릴 수 없고 이는 커넥션 관리에도 좋지 않으니 timeout 설정이 필요하다. istio는 해당 기능을 모두 제공하는데, 여기서 직접 실습해본다.
timeout
실습을 위해 simple-backend-1를 50%의 확률로 1초 딜레이가 생기도록 설정한다.
1
2
kubectl exec -it deploy/simple-backend-1 -n istioinaction -- sh
export TIMING_50_PERCENTILE=1000ms
이제 호출테스트를 진행해보면, 간혈적으로 1초의 딜레이가 생기는 것을 볼 수 있다.
1
2
3
4
for in in {1..10}; do time curl -s http://simple-web.istioinaction.io:30000 | jq .code; done
...
curl -s http://simple-web.istioinaction.io:30000  0.01s user 0.01s system 11% cpu 0.203 total
jq .code  0.00s user 0.01s system 5% cpu 0.201 total
해당 서비스는 정상적인 경우, 1초이상의 딜레이가 없는 경우라면 timeout을 0.5초로 걸어 비정상적인 응답에 대해 빠른 대응이 가능하다.
1
2
3
4
5
6
7
8
9
10
11
12
apiVersion: networking.istio.io/v1alpha3
kind: VirtualService
metadata:
  name: simple-backend-vs
spec:
  hosts:
  - simple-backend
  http:
  - route:
    - destination:
        host: simple-backend
    timeout: 0.5s
똑같이 호출테스트를 진행한다. 0.5초(1초 delay)의 경우 timeout을 진행하여 500에러로 응답하는 것을 볼 수 있다. 덕분에 비정상적인 응답을 1초에서 0.5초만에 대응할 수 있다. 만약, 1초가 아니라 100초, 300초 등이라면 더 효과가 클 것이다.
1
2
3
4
5
6
7
8
9
10
11
12
13
14
15
16
17
18
19
20
21
22
23
24
25
26
27
28
29
30
31
32
for in in {1..10}; do time curl -s http://simple-web.istioinaction.io:30000 | jq .code; done

200
curl -s http://simple-web.istioinaction.io:30000  0.00s user 0.00s system 4% cpu 0.183 total
jq .code  0.00s user 0.00s system 2% cpu 0.182 total
500
curl -s http://simple-web.istioinaction.io:30000  0.01s user 0.01s system 3% cpu 0.587 total
jq .code  0.00s user 0.01s system 1% cpu 0.586 total
500
curl -s http://simple-web.istioinaction.io:30000  0.01s user 0.01s system 2% cpu 0.568 total
jq .code  0.00s user 0.00s system 1% cpu 0.563 total
200
curl -s http://simple-web.istioinaction.io:30000  0.01s user 0.01s system 9% cpu 0.218 total
jq .code  0.01s user 0.01s system 5% cpu 0.216 total
200
curl -s http://simple-web.istioinaction.io:30000  0.01s user 0.01s system 7% cpu 0.194 total
jq .code  0.00s user 0.00s system 3% cpu 0.190 total
200
curl -s http://simple-web.istioinaction.io:30000  0.01s user 0.01s system 8% cpu 0.196 total
jq .code  0.00s user 0.00s system 4% cpu 0.194 total
500
curl -s http://simple-web.istioinaction.io:30000  0.01s user 0.01s system 3% cpu 0.549 total
jq .code  0.00s user 0.01s system 1% cpu 0.548 total
200
curl -s http://simple-web.istioinaction.io:30000  0.00s user 0.01s system 5% cpu 0.203 total
jq .code  0.00s user 0.00s system 2% cpu 0.201 total
200
curl -s http://simple-web.istioinaction.io:30000  0.01s user 0.01s system 8% cpu 0.220 total
jq .code  0.00s user 0.01s system 5% cpu 0.217 total
200
curl -s http://simple-web.istioinaction.io:30000  0.01s user 0.01s system 8% cpu 0.198 total
jq .code  0.00s user 0.01s system 4% cpu 0.194 total
Retry
다른 서비스를 호출할 때, 어떤 이유에 의해서든 서비스 상태는 정상적이나 간혈적으로 실패가 일어날 수 있다. 이때 재시도를 통해 이를 보완할 수 있는데, istio에서도 이를 지원한다.
istio는 기본적으로 재시도가 활성화되어있고, 두번까지 재시도한다.
istio는 기본적으로 해당 옵션에 대해서 재시도를 한다.
“retryOn”: “connect-failure,refused-stream,unavailable,cancelled,retriable-status-codes”
이제 HTTP 503(Service Unavailable) 상황을 고의적으로 만들어봐서, retry를 확인해본다.
1
2
3
4
kubectl exec -it deploy/simple-backend-1 -n istioinaction -- sh
export ERROR_TYPE=http_error
export ERROR_RATE=0.75
export ERROR_CODE=503
0.75의 확률로 503에러가 발생하도록 설정했다. 이제 호출테스트를 진행해본다.
재시도가 없었다면 10개중 7~8개는 500에러가 발생해야하지만, 재시도를 통해 모두 정상적인 응답이 온다.
1
2
3
4
5
6
7
8
9
10
11
12
13
14
15
16
17
18
19
20
21
22
23
24
25
26
27
28
29
30
31
for in in {1..10}; do time curl -s http://simple-web.istioinaction.io:30000 | jq .code; done
200
curl -s http://simple-web.istioinaction.io:30000  0.00s user 0.01s system 4% cpu 0.222 total
jq .code  0.00s user 0.00s system 2% cpu 0.222 total
200
curl -s http://simple-web.istioinaction.io:30000  0.01s user 0.01s system 6% cpu 0.191 total
jq .code  0.00s user 0.00s system 3% cpu 0.189 total
200
curl -s http://simple-web.istioinaction.io:30000  0.00s user 0.01s system 6% cpu 0.190 total
jq .code  0.00s user 0.00s system 3% cpu 0.187 total
200
curl -s http://simple-web.istioinaction.io:30000  0.00s user 0.00s system 4% cpu 0.192 total
jq .code  0.00s user 0.00s system 2% cpu 0.189 total
200
curl -s http://simple-web.istioinaction.io:30000  0.01s user 0.01s system 8% cpu 0.211 total
jq .code  0.00s user 0.01s system 4% cpu 0.209 total
200
curl -s http://simple-web.istioinaction.io:30000  0.01s user 0.01s system 9% cpu 0.197 total
jq .code  0.00s user 0.01s system 5% cpu 0.195 total
200
curl -s http://simple-web.istioinaction.io:30000  0.01s user 0.01s system 7% cpu 0.197 total
jq .code  0.00s user 0.00s system 3% cpu 0.194 total
200
curl -s http://simple-web.istioinaction.io:30000  0.01s user 0.01s system 10% cpu 0.210 total
jq .code  0.00s user 0.01s system 5% cpu 0.208 total
200
curl -s http://simple-web.istioinaction.io:30000  0.00s user 0.01s system 6% cpu 0.196 total
jq .code  0.00s user 0.00s system 3% cpu 0.194 total
200
curl -s http://simple-web.istioinaction.io:30000  0.01s user 0.01s system 6% cpu 0.192 total
jq .code  0.00s user 0.00s system 3% cpu 0.190 total
이제 재시도 정책을 한번 수정해본다. retryOn 조건에 503을 제외한다.
1
2
3
4
5
6
7
k edit -n istioinaction virtualservices.networking.istio.io simple-backend-vs
...
    retries:
      attempts: 2 # 최대 재시도 횟수
      retryOn: gateway-error,connect-failure,retriable-4xx # 다시 시도해야 할 오류
      perTryTimeout: 300ms # 타임 아웃
      retryRemoteLocalities: true # 재시도 시 다른 지역의 엔드포인트에 시도할지 여부
관련하여 proxy-config를 확인해보면 두번째에 우리가 설정한 오류 목록을 볼 수 있다.
1
2
3
4
5
docker exec -it myk8s-control-plane istioctl proxy-config route deploy/simple-web.istioinaction --name 80 -o json | grep retryOn
                                "retryOn": "connect-failure,refused-stream,unavailable,cancelled,retriable-status-codes",
                                "retryOn": "gateway-error,connect-failure,retriable-4xx",
                                "retryOn": "connect-failure,refused-stream,unavailable,cancelled,retriable-status-codes",
                                "retryOn": "connect-failure,refused-stream,unavailable,cancelled,retriable-status-codes",
이제 다시 호출테스트를 진행한다. 아래와 같이 간혈적으로 500에러가 발생함을 볼 수 있다.
“simple-backend-1 –(500, retry x)–> simple-web –(200)> curl(외부)”
retry가 동작하지 않는다.
1
2
3
4
5
6
7
8
9
10
11
12
13
14
15
16
17
18
19
20
21
22
23
24
25
26
27
28
29
30
31
32
for in in {1..10}; do time curl -s http://simple-web.istioinaction.io:30000 | jq .code; done

200
curl -s http://simple-web.istioinaction.io:30000  0.00s user 0.00s system 4% cpu 0.200 total
jq .code  0.00s user 0.00s system 2% cpu 0.200 total
500
curl -s http://simple-web.istioinaction.io:30000  0.01s user 0.01s system 20% cpu 0.093 total
jq .code  0.00s user 0.01s system 11% cpu 0.091 total
200
curl -s http://simple-web.istioinaction.io:30000  0.00s user 0.00s system 4% cpu 0.174 total
jq .code  0.00s user 0.00s system 2% cpu 0.173 total
200
curl -s http://simple-web.istioinaction.io:30000  0.01s user 0.01s system 7% cpu 0.188 total
jq .code  0.00s user 0.00s system 3% cpu 0.186 total
200
curl -s http://simple-web.istioinaction.io:30000  0.01s user 0.01s system 10% cpu 0.221 total
jq .code  0.01s user 0.01s system 5% cpu 0.217 total
200
curl -s http://simple-web.istioinaction.io:30000  0.01s user 0.01s system 7% cpu 0.207 total
jq .code  0.00s user 0.00s system 3% cpu 0.203 total
500
curl -s http://simple-web.istioinaction.io:30000  0.01s user 0.01s system 26% cpu 0.076 total
jq .code  0.00s user 0.01s system 14% cpu 0.074 total
500
curl -s http://simple-web.istioinaction.io:30000  0.00s user 0.01s system 24% cpu 0.043 total
jq .code  0.00s user 0.00s system 13% cpu 0.042 total
200
curl -s http://simple-web.istioinaction.io:30000  0.00s user 0.01s system 5% cpu 0.179 total
jq .code  0.00s user 0.00s system 2% cpu 0.178 total
500
curl -s http://simple-web.istioinaction.io:30000  0.01s user 0.01s system 36% cpu 0.036 total
jq .code  0.00s user 0.00s system 22% cpu 0.034 total
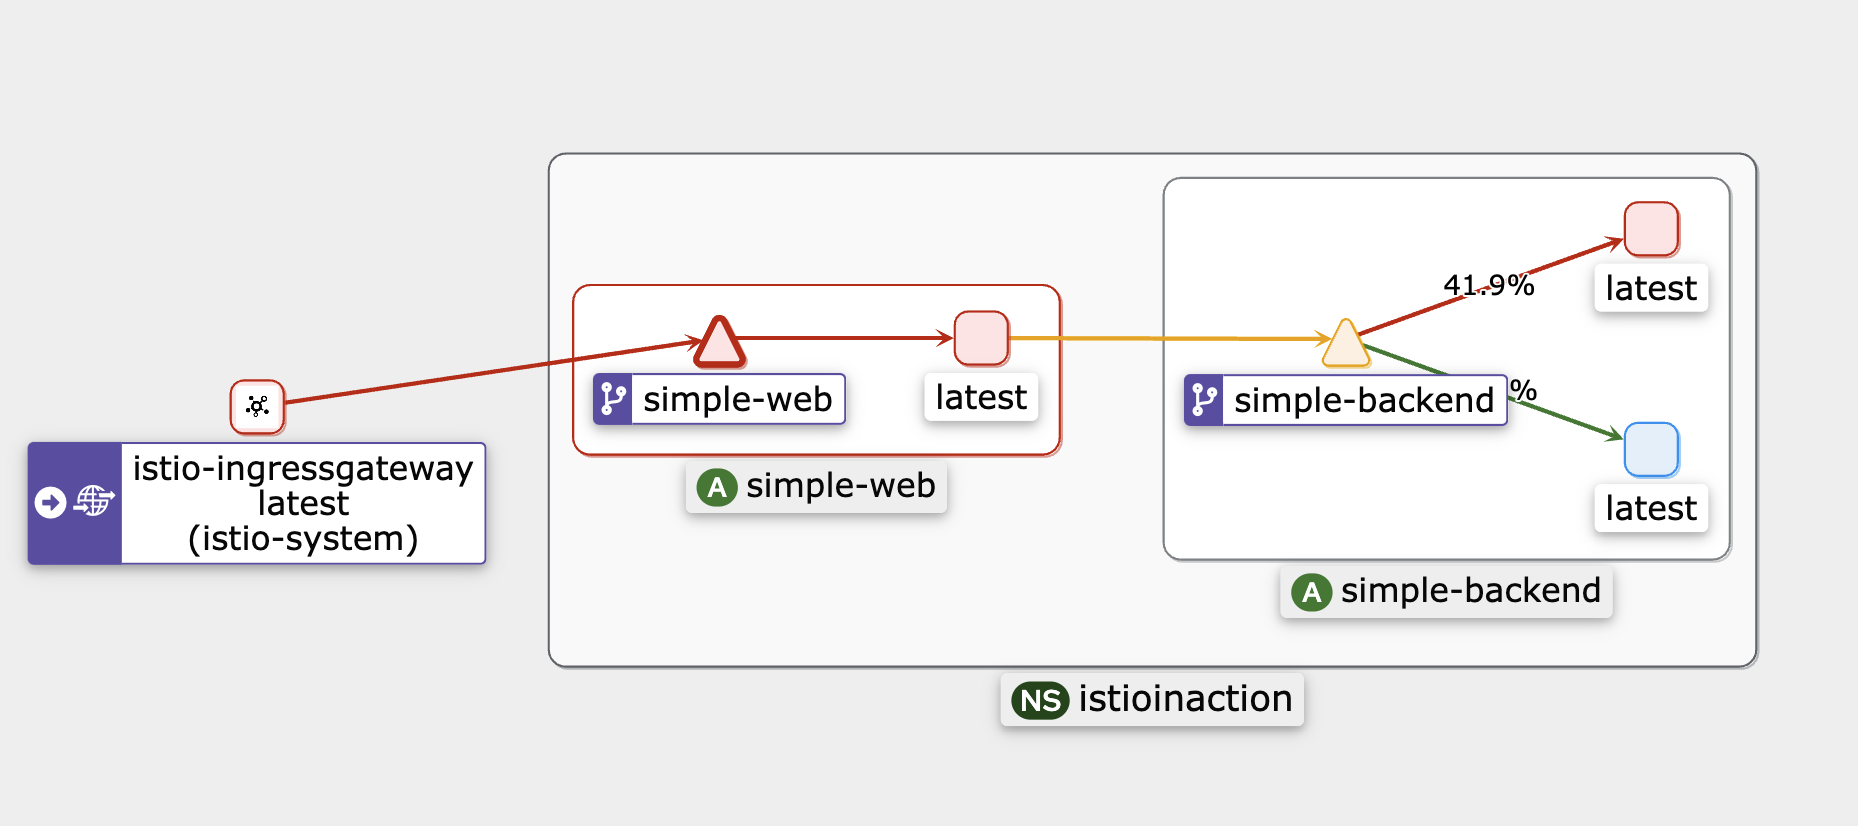
kiali에서 확인해도 동일하게 간혈적으로 에러가 뜨는 것을 볼 수 있다.(빨간, 노란색 선)
마지막으로 아래와 같이 모든 500 코드에 대해 재시도를 진행하도록 설정하면
1
2
3
4
5
6
7
8
9
10
11
12
13
14
apiVersion: networking.istio.io/v1alpha3
kind: VirtualService
metadata:
  name: simple-backend-vs
spec:
  hosts:
  - simple-backend
  http:
  - route:
    - destination:
        host: simple-backend
    retries:
      attempts: 2
      retryOn: 5xx # HTTP 5xx 모두에 재시도
“simple-backend-1 –(500, retry)–> simple-web –(200)> curl(외부)”
호출테스트가 모두 성공하는 것을 볼 수 있다.
1
2
3
4
5
6
7
8
9
10
11
12
13
14
15
16
17
18
19
20
21
22
23
24
25
26
27
28
29
30
31
32
for in in {1..10}; do time curl -s http://simple-web.istioinaction.io:30000 | jq .code; done

200
curl -s http://simple-web.istioinaction.io:30000  0.00s user 0.01s system 4% cpu 0.209 total
jq .code  0.00s user 0.00s system 2% cpu 0.209 total
200
curl -s http://simple-web.istioinaction.io:30000  0.01s user 0.01s system 8% cpu 0.200 total
jq .code  0.00s user 0.01s system 4% cpu 0.200 total
200
curl -s http://simple-web.istioinaction.io:30000  0.01s user 0.01s system 6% cpu 0.212 total
jq .code  0.00s user 0.00s system 3% cpu 0.211 total
200
curl -s http://simple-web.istioinaction.io:30000  0.01s user 0.01s system 7% cpu 0.189 total
jq .code  0.00s user 0.00s system 3% cpu 0.187 total
200
curl -s http://simple-web.istioinaction.io:30000  0.01s user 0.01s system 6% cpu 0.216 total
jq .code  0.00s user 0.00s system 3% cpu 0.215 total
200
curl -s http://simple-web.istioinaction.io:30000  0.00s user 0.01s system 6% cpu 0.223 total
jq .code  0.00s user 0.00s system 3% cpu 0.219 total
200
curl -s http://simple-web.istioinaction.io:30000  0.01s user 0.01s system 7% cpu 0.221 total
jq .code  0.00s user 0.01s system 4% cpu 0.220 total
200
curl -s http://simple-web.istioinaction.io:30000  0.01s user 0.01s system 10% cpu 0.201 total
jq .code  0.00s user 0.01s system 6% cpu 0.199 total
200
curl -s http://simple-web.istioinaction.io:30000  0.01s user 0.01s system 8% cpu 0.190 total
jq .code  0.00s user 0.00s system 5% cpu 0.188 total
200
curl -s http://simple-web.istioinaction.io:30000  0.00s user 0.01s system 5% cpu 0.203 total
jq .code  0.00s user 0.00s system 2% cpu 0.202 total